Our custom indicators were designed by D'mitri D. Richardson with the help of master programmer/analyst Chris Kryza of Divergent Software.

First invented by legends such as Wyckoff and Wilder, indicators were developed to mathematically measure a function of the market over a cycle. Knowledge of both are equally important.

These indicators seek to restore the original intent of the indicator's inventor both in terms of function, cycle, and usage. Most are programmed to eliminate lag or repainting. Some are the unique invention of CMT D'mitri D. Richardson.

All of our indicators are available at the price shown in Esignal EFS format. Most* can be translated to Tradingview for an additional cost. Some can be translated to Tradestation.

Market Indicators

Were meant to measure a function of the market over a cycle

Our Custom Indicators

Below you will find our selection of custom indicator. Each one was created to solve a problem or provide infomration about the markets that conventional indicators are unable to address. Others are simply better functioning versions of existing indicators minus problems like lag or repainting. All indicators are available in Esignal EFS format with open code. Many can be available in Tradingview for an extra charge.

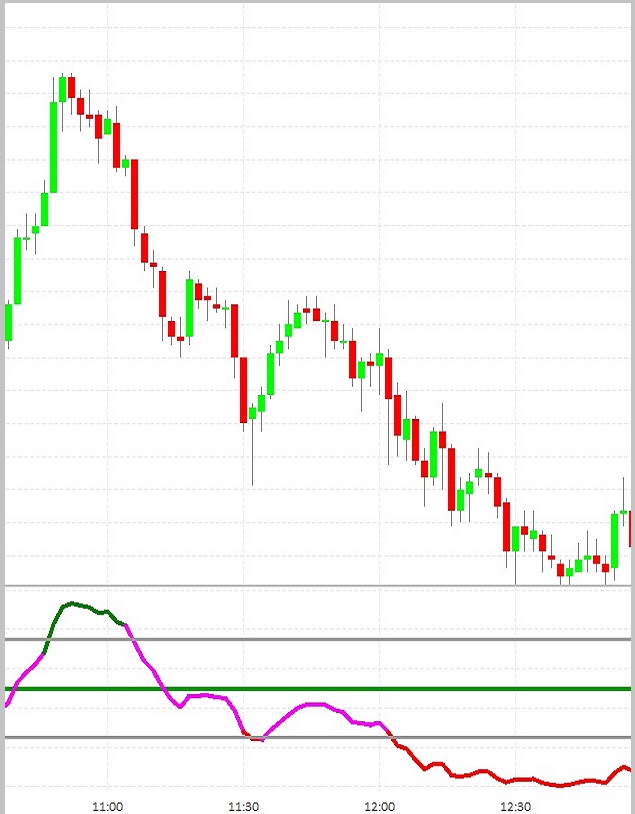
A chart showing the price of crude oil

$200.00 USD

Richardson RSI

The Richardson RSI revives Wilder's original formula and design for the RSI. A smoothing option is added using Wilder's smoothing method. Options are added to use close or OBV for in-depth divergences.

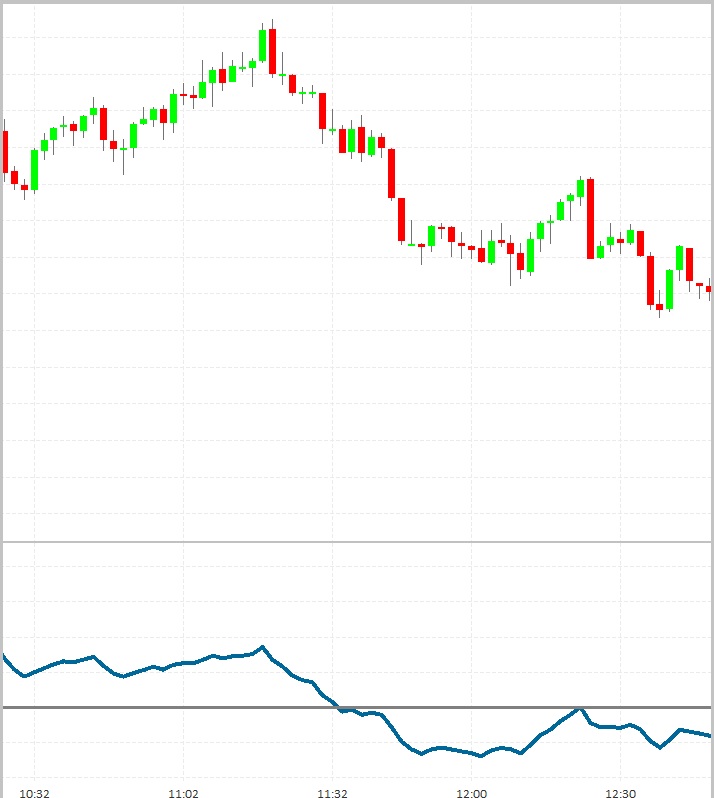
A chart showing the volatility of a currency pair.

$125.00 USD

Smooth CCI

This CCI (Commodity Channel Index) restores the original design of the indicator and adds several customizeable smoothing options without adding lag.

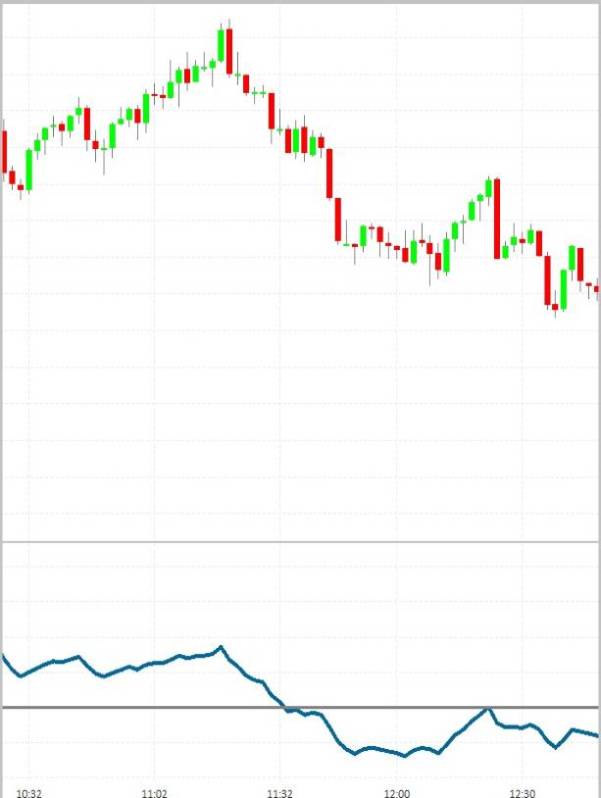
A chart showing the volatility of a stock.

$125.00 USD

Smooth Williams %R

The Smoothes %R adds consistency to your guage of the trend with several customizeable smoothing options. Great for detecting the ends of pullbacks when used in combo with the Smoothed CCI.

A chart showing the price of crude oil.

$325.00 USD

Balancing Beam

The Balancing Beam makes available several customizeable options of a proprietary formula for trend verification, stop placement, and entry. Based on W. D. Gann's theory of "Balancing a stock.

A chart showing the price of crude oil.

$375.00 USD

Gann Numbered Squares

This indicator projects price targets using 12 of Gann's numbered squares (including Square of Nine.) Customizeable with choices of price multiplier, increment, and custom degrees of projection. One of its kind in the world.

A chart showing the price of crude oil.

$200.00 USD

Time Segmented Volume

This time segmented volume allows you to select a time period and then compare the volume in that period to the same period X number of days back. Completely customizable for your own superior normalized volume indicator. Includes customizable moving average.