APPLE'S SECRET-
powerful intraday APPLE stock trading strategy.
APPLE'S SECRET is our intraday trading strategy on APPLE stock. AAPL has a secret. The secret is hidden in plain view each, and has been around as long as the stock itself. Without the right way to look at the market, the secret remains hidden.
Each day you end flat. Simple and yet profound, this trading strategy captures the core move of Apple stock each day. The market makers can be seen positioning for this move in the pre-market.
This strategy uses precise prices and times to identify pre-market patterns and only uses 1 indicator (provided with strategy.) Entry and exit made according to price and time. Indicator is only used to establish a filter, so lagging and repainting are not issues.
Performance
APPLE'S SECRET trades about once per day on average and can easily be automated.
We are unable to find a monthly drawdown going back a year. See below for 2022's results.
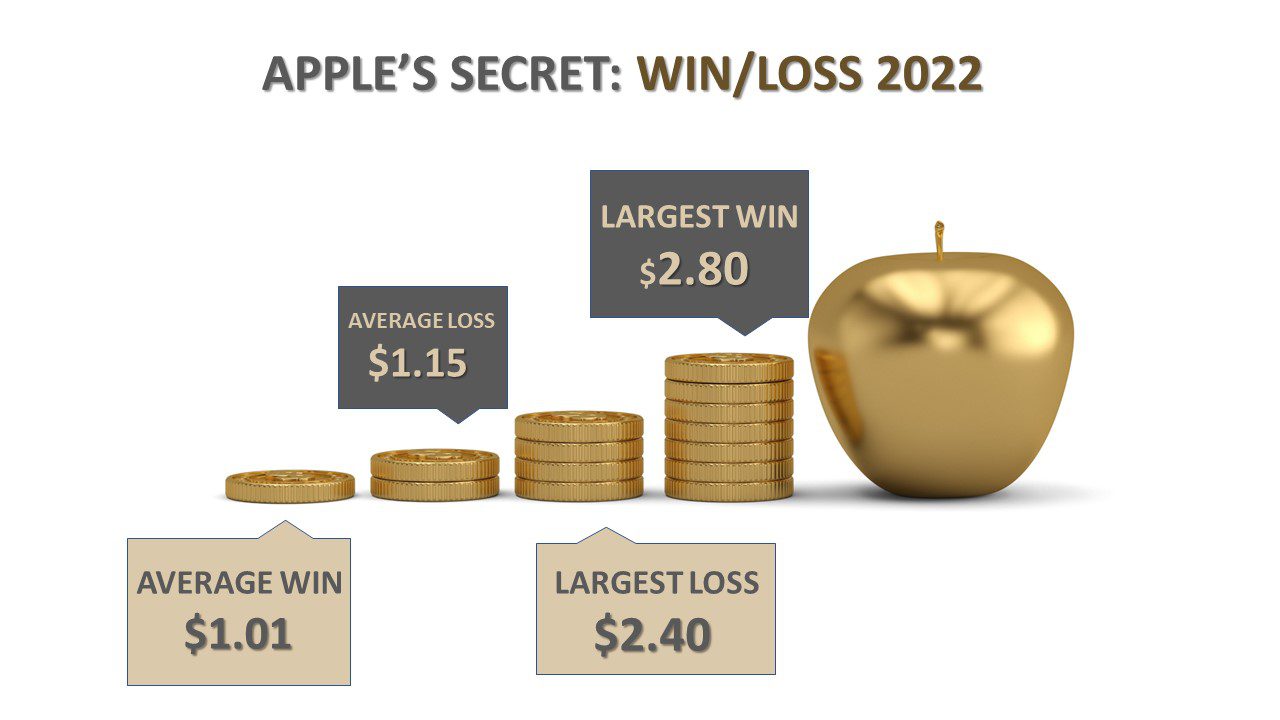
See below for net profit after slippage, largest win, largest loss, and average winning and losing trade amounts for 2022.

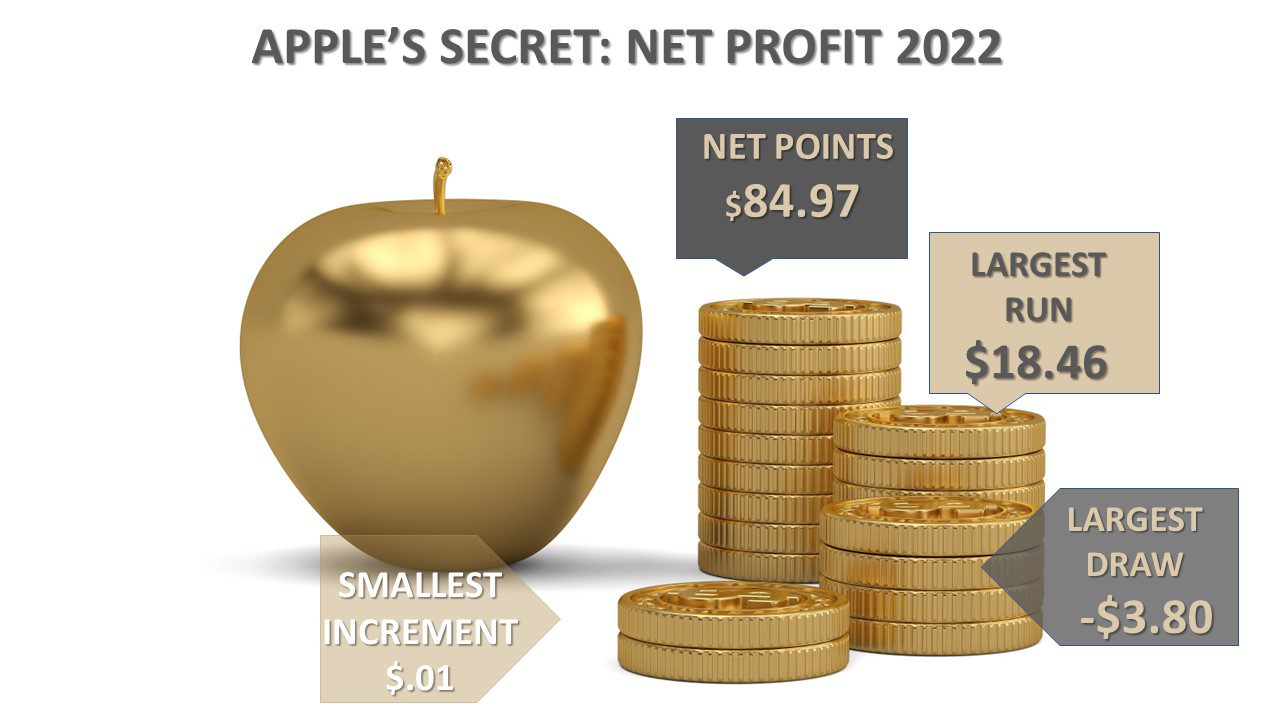
Below is the net profit in dollars ($84.97 dollars is also 8,497 ticks) after slippage, largest run, and largest drawdown. Apple's Secret uses $.01 as its smallest trading increment.

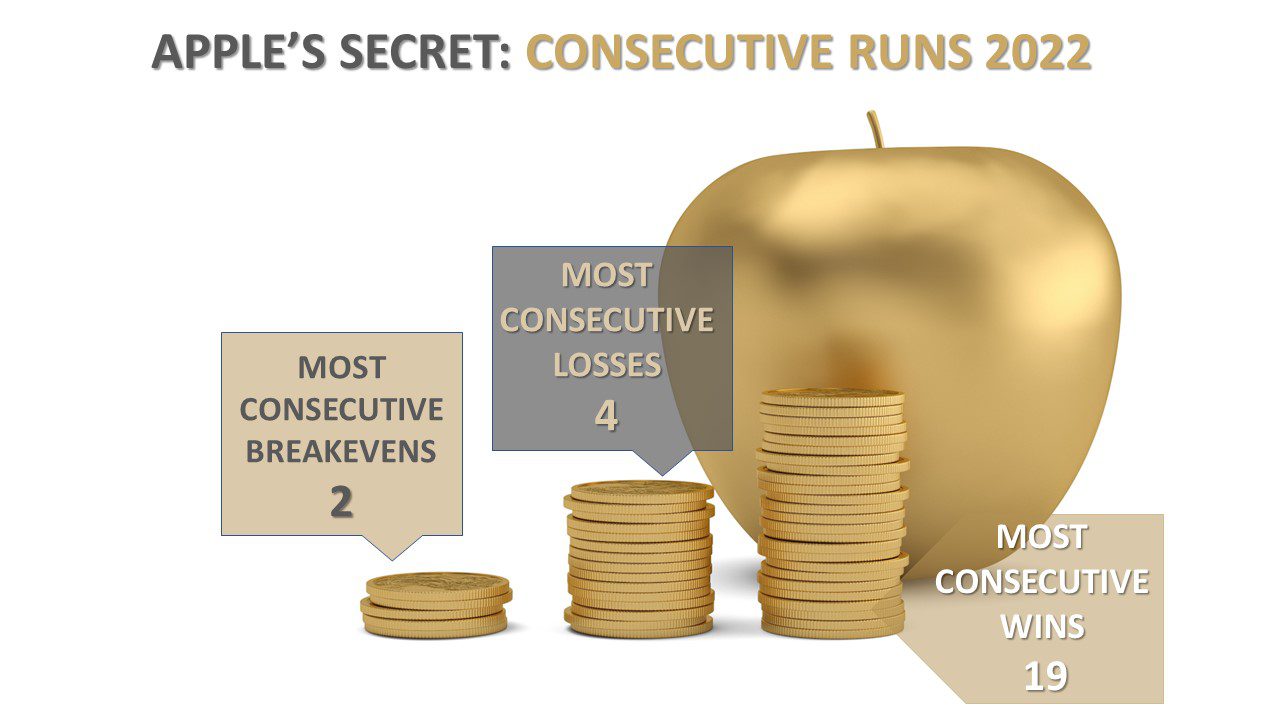
Finally, below is listed the most consecutive wins, losses, and breakevens. The breakeven trade in Apple's Secret is a true breakeven.

Futures, Equities, and Options trading/investing has large potential rewards, but also large potential risk and is not suitable for everyone. You must be aware of the risks and be willing to accept them in order to invest in the equities, futures and options markets. Do not trade with money you can’t afford to lose. This is neither a solicitation nor an offer to Buy/Sell futures, stocks or options on the same. No representation is being made that any account will or is likely to achieve profits or losses similar to those shown on this website. The past back-testing performance of any trading method, strategy, or technical analysis technique, strategy or methodology is not necessarily indicative of future results. No one associated with RGS or this website are Registered Investment Advisors, Commodity Trading Advisors, or certified, registered, affiliated or approved in in any way with either the National Futures Association, Securities and Exchange Commission, Commodities Futures Trading Commission, or any other organization.
Recipients of market strategies, indicators, and other market solutions from RGS receive hypothetical, back–tested data and not actual trade results. Technical analysis, indicators, strategies, and market solutions, including any descriptions or evaluations of their performance, included in this training and displayed on this website, are described and evaluated based on hypothetical back-testing, and not the actual trades or earnings of any individual or entity. The many strategies and techniques represented on this website include far more applications to market instruments and time frames than the presenter can possibly implement. Author & presenter has sources of income in addition to work with financial markets. In any and all descriptions displayed on this website, no individual or entity, including past clients or presenter, “hold themselves out” as achieving any level of success trading, investing, or amassing any level of wealth or income derived from any or all of the strategies, techniques, information, or market solutions offered on this website.
Nothing displayed on this website or offered in any training on this website constitutes a “futures trading system” or a “stock trading system.” Nothing shown or described on this website should be taken as any individual or entity claiming, inferring, or insinuating, investment advice in any way. No one associated with any training or information on this website accurately verifies or tracks results of past clients.
CFTC RULE 4.41
HYPOTHETICAL OR SIMULATED PERFORMANCE RESULTS HAVE CERTAIN LIMITATIONS. UNLIKE AN ACTUAL PERFORMANCE RECORD, SIMULATED RESULTS DO NOT REPRESENT ACTUAL TRADING. ALSO, SINCE THE TRADES HAVE NOT BEEN EXECUTED, THE RESULTS MAY HAVE UNDER-OR-OVER COMPENSATED FOR THE IMPACT, IF ANY, OF CERTAIN MARKET FACTORS, SUCH AS LACK OF LIQUIDITY. SIMULATED TRADING PROGRAMS IN GENERAL ARE ALSO SUBJECT TO THE FACT THAT THEY ARE DESIGNED WITH THE BENEFIT OF HINDSIGHT. NO REPRESENTATION IS BEING MADE THAT ANY ACCOUNT WILL OR IS LIKELY TO ACHIEVE PROFIT OR LOSSES SIMILAR TO THOSE SHOWN.
Your results may differ from back-testing statistics. Intraday market strategies comprise part of our market strategy portfolio. This does not mean we recommend them, or “day trading” to everyone. Intraday trading requires a higher degree of accuracy, platform, consistency, capital, and discipline to use profitably. In a 2014 UC paper that studied 3.7 billion TSE trades from 1992-2006, only 3% of “day traders” profited on an average day. On August 19, 2019 the San Paolo School of Economics published a study tracking at 1,551 retail traders for at least 300 short-term futures trades in iBovespa contracts. They found only 1.1% posted higher average net returns than the Brazilian minimum wage over a year. Though we lack studies of a comparable scope on US traders on US markets, we estimate the % of profitable retail intraday traders to be under 8%.


